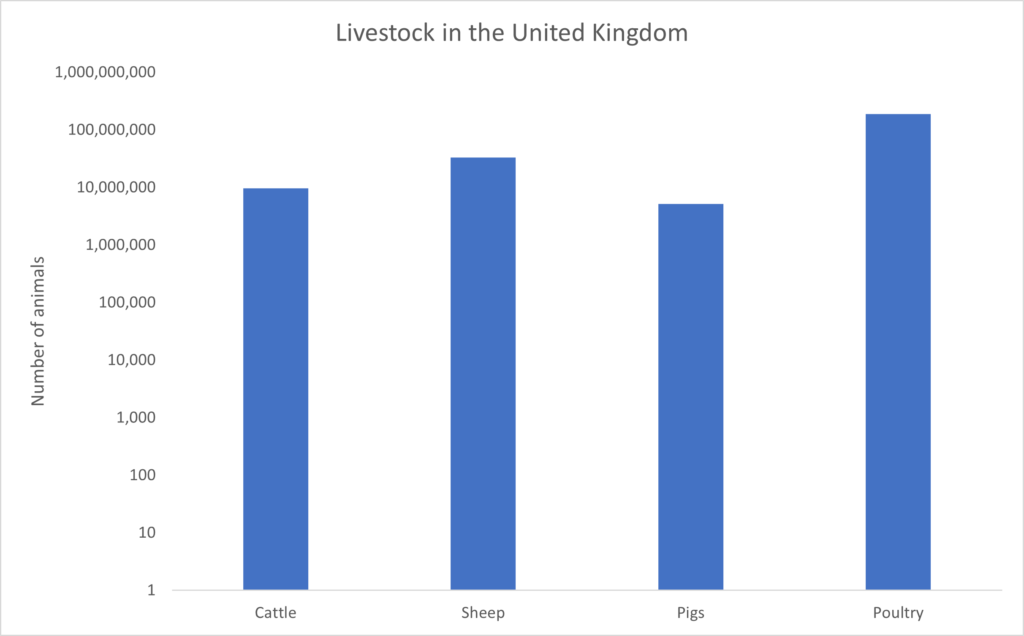
Bar graph depicting the number of Cattle, Sheep, Pigs, and Poultry in the United Kingdom. Data from https://www.gov.uk/government/statistics/livestock-populations-in-the-united-kingdom
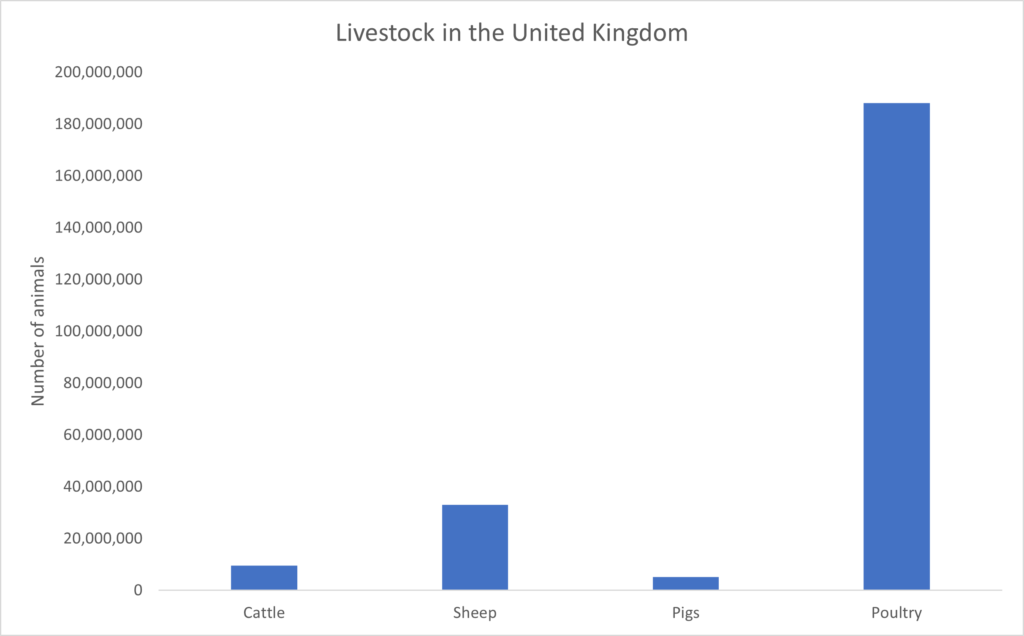
The bar graph below depicts the same data, except it is represented using a logarithmic scale. Notice the numbers along the y axis: